


Every person with a visual impairment sees
the world in a different way.But they often
find it difficult to explain in words what it is
they see. If there was a way to share their
experience, we could create new dialogue
between the visually impaired and the
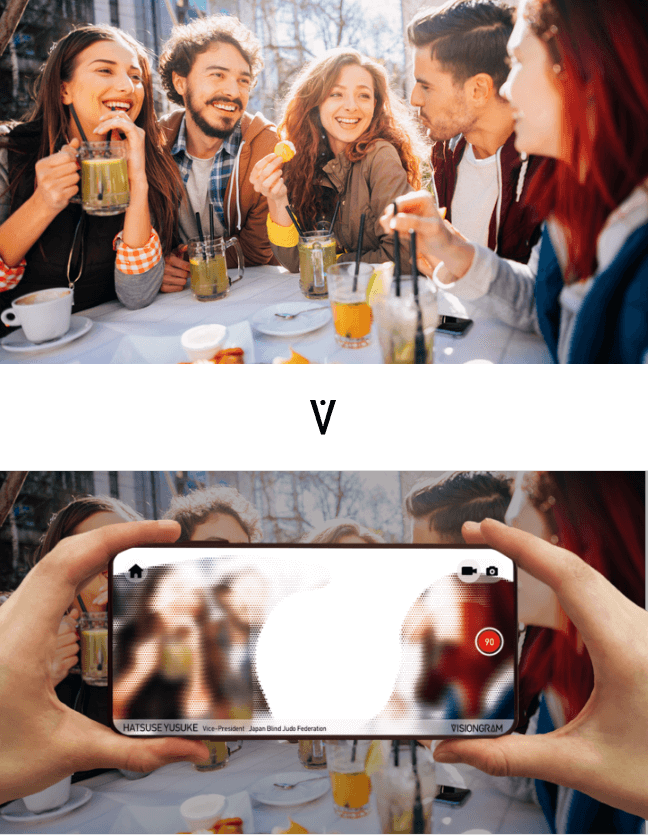
visually abled. VISIONGRAM is a tool for
visualizing visual impairment. Data from an
individual’s disability test is used to create
a digital visual filter that allows the visually
abled to see the world in the same way.By
deepening the public’s understanding of
visual impairment,VISIONGRAM can help
create a world where the visually impaired
can feel more understood.


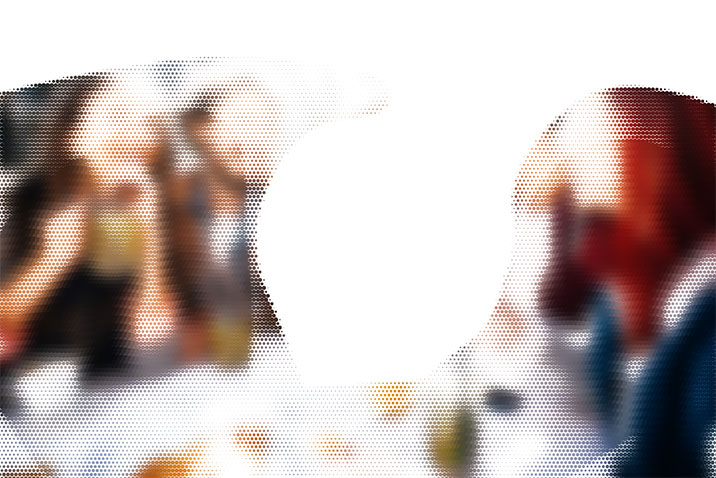
Data from an individual’s disability test is used to create a digital visual filter that allows the visually abled to see the world in the same way. The filter simulates the visual acuity, visual field, and sensitivity of the individual by adjusting the size and density of the pixels on a digital screen.
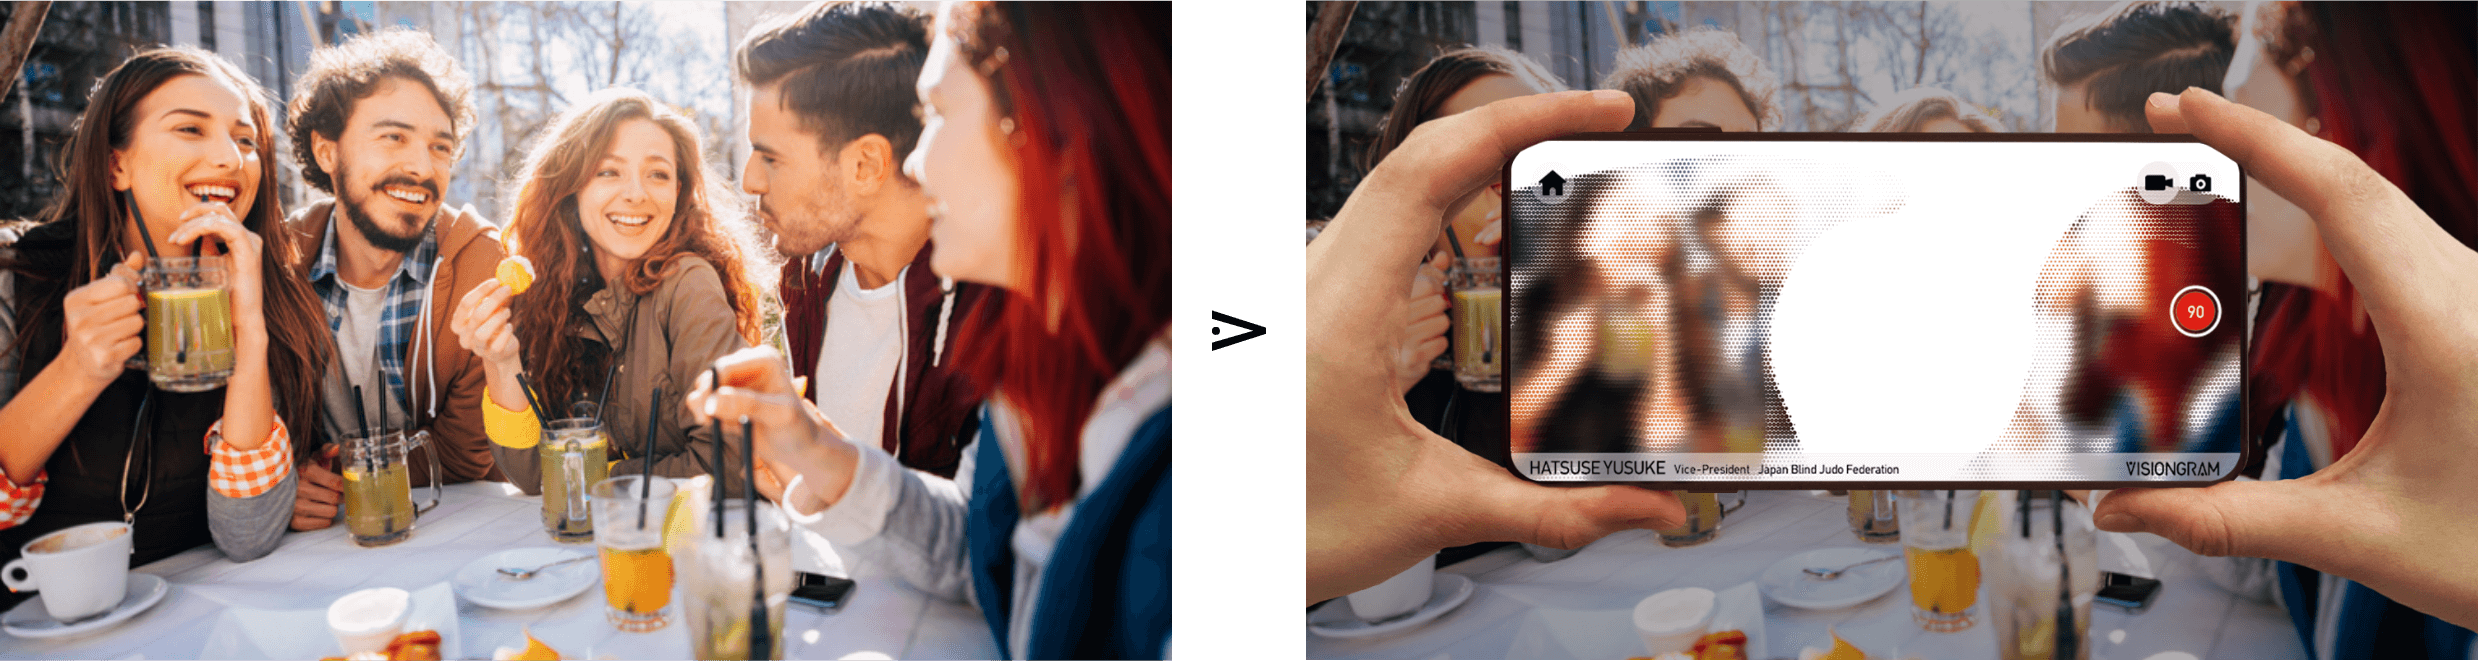

The pixel is the smallest building block of a digital video or image. By adjusting the size and density of the pixels, we can reproduce the world as seen by the visually impaired in a way that is both authentic and not data-heavy, making it easier to share videos and images produced using the filter.

Simulating visual acuity
Visual acuity is simulated by changing the number of pixels on the screen. The lower the acuity, the fewer the number of pixels, resulting in a blurred, unclear image.

Simulating visual field and sensitivity
Missing areas of vision are simulated onscreen using data from the Goldmann visual field test. Meanwhile, sensitivity is simulated by changing the size of the pixels: more sensitive areas of vision are represented by larger pixels, while less sensitive areas are represented by smaller pixels.
Missing areas of vision
Missing areas of vision are displayed differently depending on how the visually impaired individual describes them (e.g., white, black).
In visual acuity less than 0.01, there are four levels: counting fingers (CF), hand motion(HM),
light perception (LP) and no light perception (NLP).

Counting Finger
Pixels appear in response to the object in front of you, with enough resolution to tell how many fingers are held out.

Hand Motion
Pixels appear in response to the object in front of you, with enough resolution to vaguely perceive the movement of a hand held out.

Light Perception
The screen color changes depending on the brightness of the space. It gets close to white in bright areas, and close to black in dark areas.
One of the three color-sensing cells, the red cone, green cone, and blue cone, may be missing or not functioning adequately.
VISIONGRAM supports the following 8 types of color vision deficiency.
8 types of color vision deficiency


Protanopia

Deuteranopia

Tritanopia

Achromatopsia


